
Evidence of Rapid Climate Change
|
Navigation
"Every indicator we have in terms of giving us an early warning of climate change and increasing vulnerability is giving us a very strong signal. It is across the board, it is not just global temperatures. It is in human health aspects, in forests, sea levels, agriculture, biodiversity - the signals are coming in from right across the environment." ~European Environment Agency Executive Director Jacqueline McGlade Learn more. |
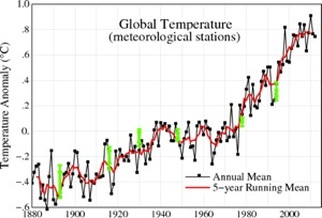 Image: NASA GISS | Click for source
The evidence of rapid climate change is irrefutable and effectively transcends all social, economic, political and environmental bounds. Everything is affected. Since 1880, the average global temperature has risen about 0.8°C (1.4°F), resulting in many of the weather extremes and climatic changes we see today, however, the most comprehensive CO2 study to date by the Global Carbon Project, published by leading scientists in the journal Nature Geoscience, says that the world is now firmly on course for the worst-case scenario in terms of climate change, with average global temperatures rising by up to 6°C (11.5°F) by the end of the century (PwC study) (see also). The effects of climate change are becoming alarmingly visible throughout America and the rest of the world. The 2013 draft National Climate Assessment states, "Many aspects of the global climate are changing rapidly, and the primary drivers of that change are human in origin. Evidence for climate change abounds, from the top of the atmosphere to the depths of the oceans (Kennedy et al. 2010). This evidence has been painstakingly compiled by scientists and engineers from around the world using satellites, weather balloons, thermometers at surface stations, and many other types of observing systems that monitor the Earth’s climate system. The sum total of this evidence tells an unambiguous story: the planet is warming. Temperatures at the surface, in the troposphere (the active weather layer extending up to about 8 to 12 miles above the ground), and in the oceans have all increased over recent decades." World Meteorological Organization: 'Climate Change is Taking Place Before Our Eyes'
|

|
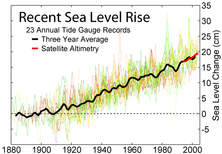
Sea Level Rise
Global sea levels rose about 17 centimeters (6.7 inches) in the last century. The rate in the last decade, however, is nearly double that of the last century and NASA scientists are predicting it could be as much as several meters sea level rise this century, if global warming is not addressed. With 70% of the world's population living on low-lying coastal plains and with 60% of the 39 largest metropolitan areas with a population over 5 million, including 12 of the 16 with populations exceeding 10 million, located within 100km of the coast, sea level rise is a global problem that affects far more than just small island nations. Sea levels, which are now rising 60% faster than previously estimated up until 2011, could rise 6 feet by 2100, 18-29 feet above current levels over the next few centuries and 69-200 feet in the next, at least, 1000-2000 years, if we continue our current carbon emissions path. Learn more.
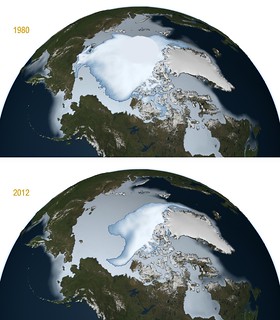
Shrinking Ice Sheets Compared to the rest of the world, average temperatures in the Arctic region are rising twice as fast and three times as fast in Western Antarctica, which is one of the fastest-warming regions on Earth. Every year, arctic ice is getting thinner, melting and rupturing as seen in the total arctic sea ice volume, which has been reduced to one fifth of its level in 1980, and in Greenland, which is losing 200 billion tons of ice every year. Since 1979, the volume of summer Arctic sea ice has declined by 75% and is accelerating, while Greenland ice melt increased nearly five-fold since the mid-1990s and Antartica’s ice loss increased 50% in past decade. According to a study published in the journal Environmental Research Letters, at least 75% and as much as 95% of this Arctic sea ice loss is a result of human activities, such as burning fossil fuels (see also). Images from NASA satellites show that the area of permanent ice cover is now declining at a rate of 11.5% per decade, relative to the 1979 to 2000 average, with sea ice covering the Arctic Ocean reaching a record low minimum extent of 1.32 million square miles, breaking the previous record by 18%. If this trend continues, summers in the Arctic could become ice-free in as few as 30 years. Learn more.
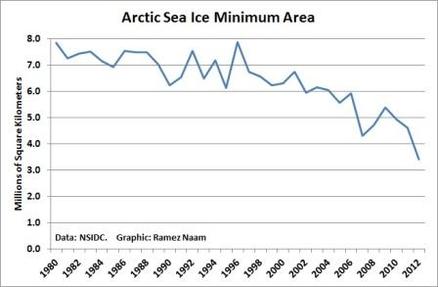
Arctic sea ice coverage in September, 2012, has dropped in half since 1980, and the drop appears to be accelerating. Source: Scientific American | Click for source
Coral Bleaching Coral Reefs are disappearing four times faster than the rainforest. Due mainly to warming temperatures, acidifying oceans and pollution, close to 30% of the ocean’s reefs have already vanished since 1980, including half of the reefs in the Caribbean, and scientists forecast that Australia’s Great Barrier Reef may be dead by the year 2050, tropical corals could be gone by the middle to the end of this century, cold-water corals will be severely stressed by 2040 with two-thirds of them in a corrosive environment by the century’s end, 70% of the world's coral reefs will be destroyed by the year 2050 and all coral reefs could be gone by the end of the century. Learn more.
Global Change Institute: Climate Change: Coral Reefs on the Edge
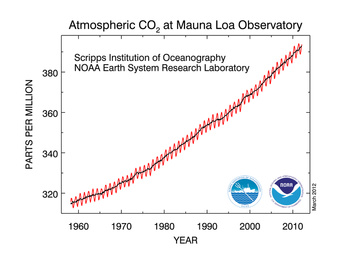
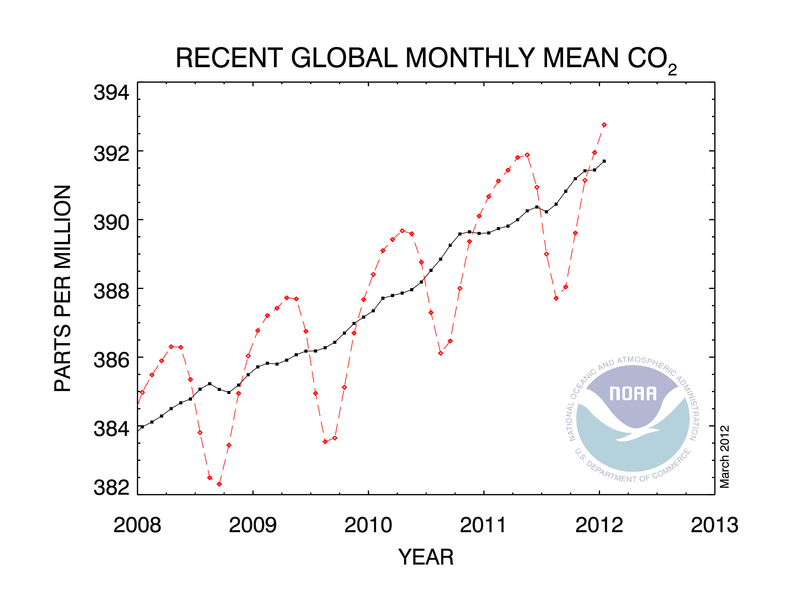
Rise in Carbon Dioxide Concentration Carbon dioxide (CO2) is an important heat-trapping greenhouse gas, which is released through human activities, such as deforestation and the burning of fossil fuels, as well as natural processes, such as respiration and volcanic eruptions. Without carbon dioxide, there would be no life on Earth, however, too much of a good thing can be bad. As the world continues to produce 2.4 million pounds of CO2 a second, the atmospheric levels of carbon dioxide are continuing to rise at an accelerating rate, mainly from the burning of fossil fuels, reaching a new record high in 2011. According to the World Meteorological Organization, "Between 1990 and 2011 there was a 30% increase in radiative forcing — the warming effect on our climate — because of carbon dioxide (CO2) and other heat-trapping long-lived gases. Since the start of the industrial era in 1750, about 375 billion tonnes of carbon have been released into the atmosphere as CO2, primarily from fossil fuel combustion. Despite all of this knowledge, the world has largely failed to act on reducing emissions." Scientists warn the maximum "safe" limit of CO2 in the atmosphere is 350ppm, we are currently at 395.55ppm and rising about 2ppm per year. By 2100, the IPCC estimates a range of 500-1000ppm by 2100 compared to 280ppm pre-industrial times. Learn more.
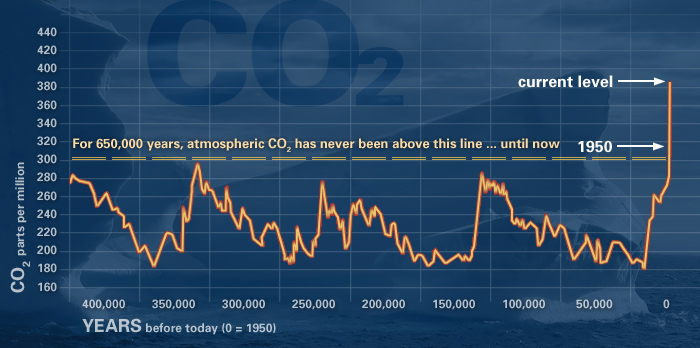 This graph, based on the comparison of atmospheric samples contained in ice cores and more recent direct measurements, provides evidence that atmospheric CO2 has increased exponentially since the Industrial Revolution. Source: NOAA | Click to enlarge
800,000 Year Record of Carbon Dioxide (CO2) Concentrations
"Over the last 800,000 years, natural factors have caused the atmospheric carbon dioxide (CO2) concentration to vary within a range of about 170 to 300 parts per million (ppm). The concentration of CO2 in the atmosphere has increased by roughly 35 percent since the start of the industrial revolution. Globally, over the past several decades, about 80 percent of human-induced CO2 emissions came from the burning of fossil fuels, while about 20 percent resulted from deforestation and associated agricultural practices. In the absence of strong control measures, emissions projected for this century would result in the CO2 concentration increasing to a level that is roughly 2 to 3 times the highest level occurring over the glacial-interglacial era that spans the last 800,000 or more years." ~ NOAA, Image Credit: NOAA
|
Global Temperature Rise
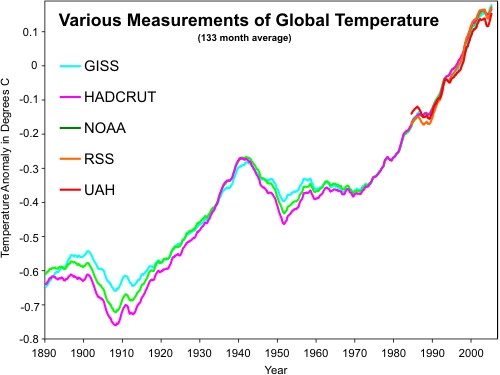
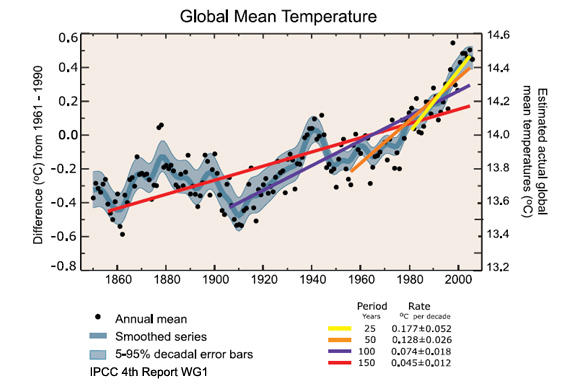
All three major global surface temperature reconstructions show that the Earth has been warming since 1880, including human-induced global ocean warming, with the past decade being the warmest on record according to scientists in 48 countries and 2012 being the hottest year ever in the U.S. with 362 all-time record highs and zero all-time record lows, and 34,008 daily high records being broken (WRI: By the Numbers) at weather stations across the country and the second most extreme for weather. There are now an average of five times as many record-breaking hot months worldwide with an 80% chance that a new monthly heat record is due to climatic change. Even though the last decade witnessed a solar output decline resulting in an unusually deep solar minimum in 2007-2009, surface temperatures continued to increase, due to anthropogenic emissions of greenhouse gases, such as carbon dioxide, and results of a study by researchers at OSU and Harvard University published in the journal Science show that the rate of warming since 1900 is 50 times greater than the rate of cooling in the previous 5000 years (see also). Learn more.
Source: NASA Finds 2012 Sustained Long-Term Climate Warming Trend | Data Source: NASA Goddard Institute for Space Studies | Visualization Credit: NASA Goddard Space Flight Center Scientific Visualization Studio.
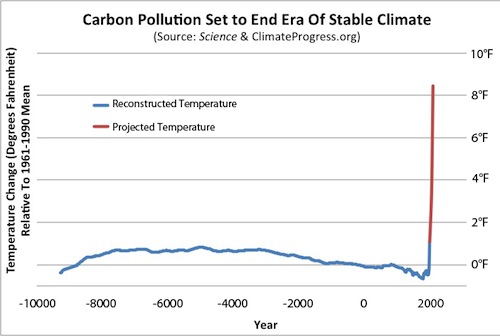
Temperature change over past 11,300 years (in blue, via Science, 2013) plus projected warming this century on humanity’s current emissions path (in red, via recent literature). Source: Science & ClimateProgress.org | Click to enlarge
Ocean Acidification Since the beginning of the industrial revolution, the release of carbon dioxide into the atmosphere has increased exponentially. The ocean absorbs about half of the CO2 we release into the atmosphere every year, so as atmospheric CO2 levels increase, so do the levels in the ocean - making them more acidic. Our current acidification rates are unparalleled in Earth's history and will lead most ecosystems into unknown territory. The acidity of the planets oceans have risen by 30% since the industrial revolution by absorbing 530 billion tons of CO2, and the current rate of ocean acidification is at least a hundred times faster than any time in the last few hundred thousand years and is most likely unprecedented in the Earth’s history. If we continue on our currents emissions trajectory, by the end of the century the acidity of the planet’s oceans could be more than double what it was prior to the industrial revolution. Learn more.
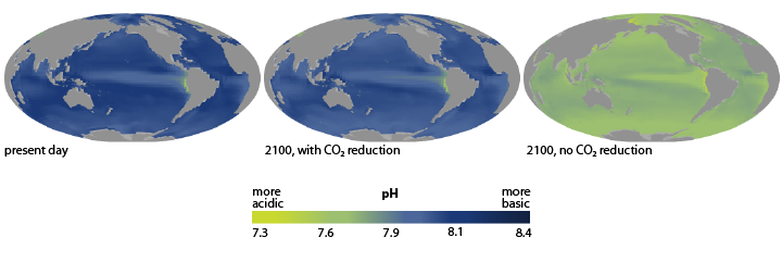
Image: NOAA Climate Services: Ocean Acidification Today and in the Future | Click to enlarge
A major 23-author science paper published in Science, states the world’s oceans may be turning acidic faster today from human carbon emissions than they did during four major extinctions in the last 300 million years, when natural pulses of carbon sent global temperatures soaring. Learn more.
Oceanic pH Levels in the Past 25 Million Years and Now
Source: EUR-OCEANS, 2007
"Unless we curb carbon emissions we risk mass extinctions, degrading coastal waters and encouraging outbreaks of toxic jellyfish and algae. A unique ‘natural laboratory’ in the Mediterranean Sea is revealing the effects of rising carbon dioxide levels on life in the oceans. The results show a bleak future for marine life as ocean acidity rises, and suggest that similar lowering of ocean pH levels may have been responsible for massive extinctions in the past. A tipping point occurs at mean pH 7.8. This is the pH level predicted for the end of this century" ~Geologic Society of London Learn more. 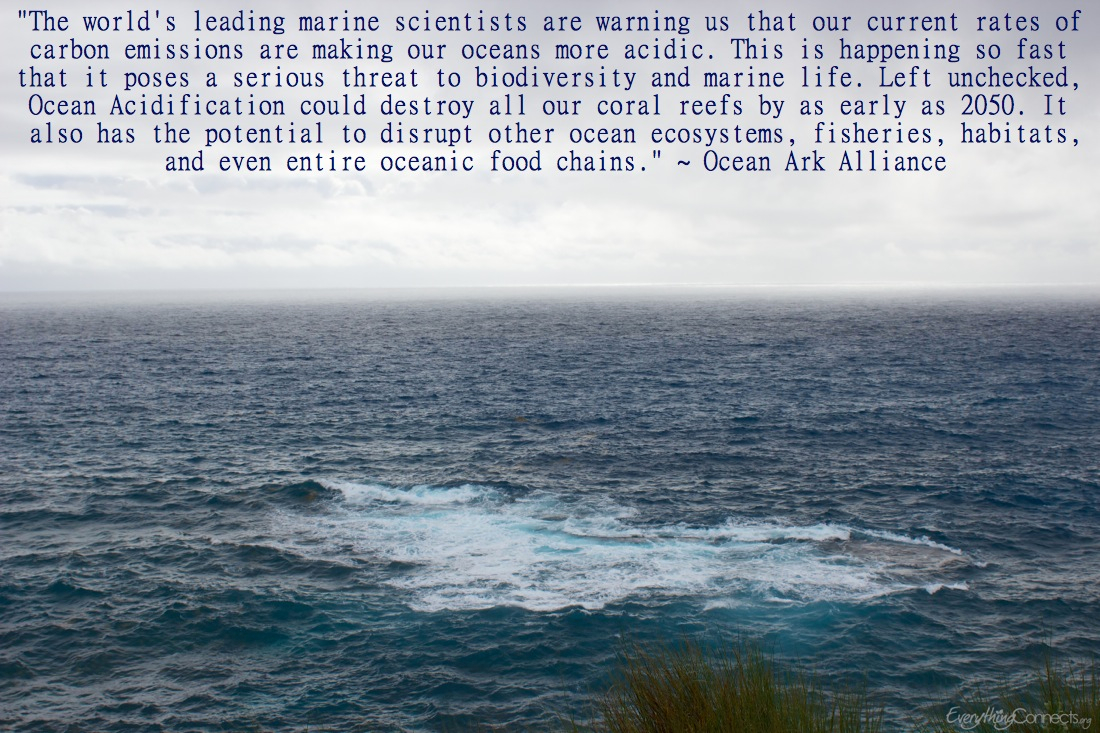
Click to enlarge | Learn more
More Intense Climate Extremes Like a baseball player on steroids, global warming exacerbates the risk factors for extreme weather events by contributing to the intensity, frequency and duration of these extreme weather events. According to an IPCC worldwide scientific collaboration of 62 counties, 220 authors and 18,611 review comments and simple observations made by people all over the world, there has been and at present trends, will continue to be an increase in warm daily temperature extremes, more intense heat waves, heavy precipitation events, such as flooding, an increase in the maximum wind speeds of hurricanes, intensified droughts, wildfires and increases in sea level rise. In 2011, there was a record 14 billion dollar disasters in the U.S., and 11 billion dollar disasters in 2012. There is now strong evidence linking specific events or an increase in their numbers to the human influence on climate. Moreover, climate change may bring '100 year-storms' every at least 3 years, according to a team of scientists from MIT and Princeton University. According to “Severe weather in North America,” by Munich Re, the world's largest reinsurance company, there has been a nearly quintupled number of weather-related loss events in North America for the past three decades, compared with a quadrupling in Asia, 2.5 times as many events in Africa, twice as many in Europe and 1.5 times in South America. According to Kevin E. Trenberth, senior scientist at the National Center for Atmospheric Research, in the journal Climatic Change, "The answer to the oft-asked question of whether an event is caused by climate change is that it is the wrong question. All weather events are affected by climate change because the environment in which they occur is warmer and moister than it used to be. The air is on average warmer and moister than it was prior to about 1970 and in turn has likely led to a 5–10 % effect on precipitation and storms that is greatly amplified in extremes. The warm moist air is readily advected onto land and caught up in weather systems as part of the hydrological cycle, where it contributes to more intense precipitation events that are widely observed to be occurring." Learn more.
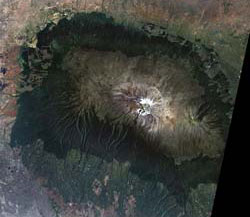
Glacial Volume is Shrinking "Warming temperatures lead to the melting of glaciers and ice sheets. The total volume of glaciers on Earth is declining sharply. Glaciers have been retreating worldwide for at least the last century; the rate of retreat has increased in the past decade. Only a few glaciers are actually advancing (in locations that were well below freezing, and where increased precipitation has outpaced melting). The progressive disappearance of glaciers has implications not only for a rising global sea level, but also for water supplies in certain regions of Asia and South America." ~NOAA. Learn more.
Glaciers in the South American tropical Andes have been shrinking at the fastest rate in the past 300 years. Since the 1970s, they've shrunk by an average of 30-50%. Learn more.

Source: Oerlemans et al., Climate Dynamics, 1998/UNEP/G.R.I.D. | Click to enlarge
Declining Northern Snow Cover
|

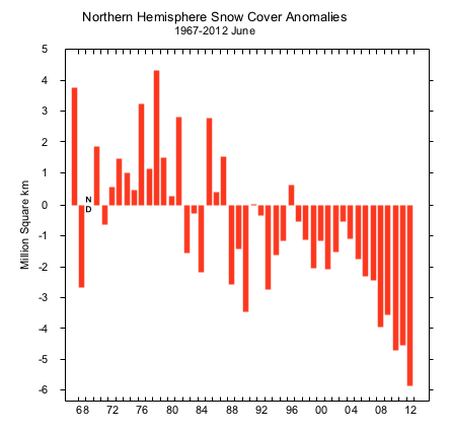

"While the U.S. as a whole has seen a warming trend that has raised annual average temperatures by 1.3°F over the past 100 years, warming varies seasonally, and it’s winter that has seen the fastest warming. An analysis of data from the U.S. Historical Climatology Network of weather stations shows that the coldest states are warming the fastest, and across the country winter warming since 1970 has been more than four-and-a-half times faster per decade than over the past 100 years. Winter nights across the country have warmed about 30 percent faster than nights over the whole year. Some states cooled or failed to join the warming trend over the past 100 years, but since 1970, every state has shown winter-warming." ~Climate Central
For more Evidence of Rapid Climate Change, visit:
NASA Global Climate Change Key Indicators NOAA Global Climate Change Indicators IPCC Evidence of Anthropogenic Climate Change EPA - Climate Change Indicators in the U.S. The Nature Conservancy - Climate Change Indicators WWF - Climate Change Indicators in the U.S. EEA - Climate Change Indicators |
| ||||
|
Last Revised: 11/20/13
Commenting Rules |